India’s industrial output rose 8% in August, led by factories and power
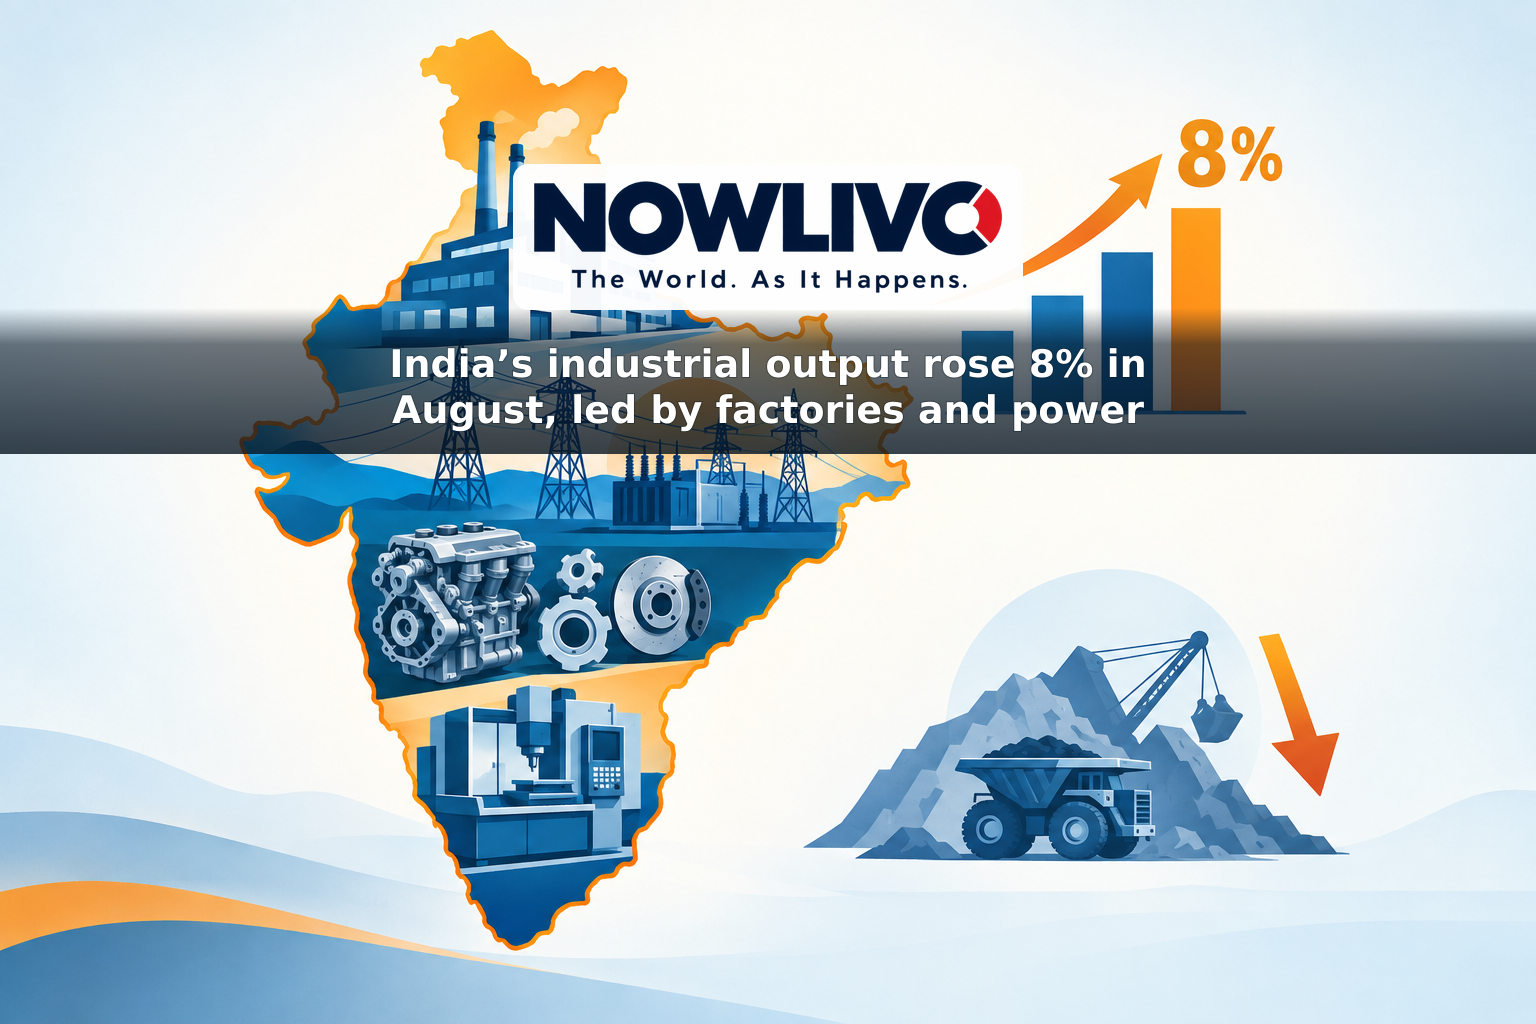
India produced 8% more industrial goods in August 2026 than in August 2025, according to figures released on September 28 by the Ministry of Statistics and Programme Implementation. The rise in the Index of Industrial Production, or IIP, was driven chiefly by manufacturing, with additional support from electricity and gas supply. Mining moved in the opposite direction.

The headline figure measures the volume of industrial output, not the value of sales or the pace of the entire economy. It is a year-on-year comparison: an 8% increase means measured production was higher than in the same month last year, not that it rose 8% from July. The overall index stood at 123.3 in August, compared with 114.2 a year earlier, using 2022–23 as its base year.
Which sectors drove the increase?
Manufacturing output rose 9% from a year earlier. That matters most to the overall result because manufacturing accounts for about 76% of the index. Electricity and gas supply grew 12.3%, while water supply, sewerage and waste management increased 6.3%. Mining and quarrying output fell 5.6%, partly offsetting those gains.
The factory expansion was not confined to one product line: 18 of the 23 manufacturing industry groups recorded growth. Among the leading contributors were motor vehicles, trailers and semi-trailers, whose output rose 25.2%; electrical equipment, up 30.9%; and other transport equipment, up 25.3%. Those categories include products and components used by households, transport operators and other businesses. Their gains help explain why overall production advanced even as mining contracted.
The index also groups goods by their likely use. Capital goods, a category associated with machinery and equipment, rose 16.9%. Intermediate goods, which enter further stages of production, grew 13.7%. Consumer durables increased 11.1%. These three categories made the largest positive contributions to August’s overall growth under the use-based breakdown. Infrastructure and construction goods rose 6.4%, and primary goods increased 3.5%.
Growth was less even among products bought regularly by households. Consumer non-durables rose just 2.1%. The contrast with durables suggests that stronger factory output cannot be read as equally strong demand across every part of the consumer market.
What could it mean for businesses?
Rising production of capital and intermediate goods is an encouraging sign for firms that make machinery, components or materials for other producers. It may reflect stronger orders, inventory rebuilding or preparation for future demand. Higher output can also create opportunities for suppliers, transport companies and distributors that serve growing factories.
But the index does not show why each factory increased production or whether its additional goods have already been sold. A company considering new investment would need to weigh this reading alongside its own orders, inventories, costs and expectations for the months ahead. The decline in mining is another reminder that industrial conditions differ substantially by sector.
What could consumers take from it?
More production of vehicles and other durable goods may improve the availability of some products if that output reaches retailers. It does not, on its own, mean prices will fall or that households have more money to spend. Retail prices also depend on input costs, transport, taxes and sellers’ decisions, while factory production is not a direct measure of wages or jobs.
August’s 8% annual growth was above July’s revised 7.4% rate. July had initially been reported at 6.7%, illustrating why early IIP figures need to be treated as provisional. Year-on-year growth can also look stronger when the comparable month a year earlier was relatively subdued. A single monthly reading is therefore useful evidence of industrial momentum, not a guarantee that the pace will continue.
The clearest conclusion is that factories and utilities delivered a strong August, particularly in equipment, production inputs and durable goods. For households and businesses, the next question is whether subsequent readings show that strength spreading to everyday consumer products and persisting beyond one month.