IMD Study Finds India’s North Has Grown Drier While Peninsula Gets Wetter
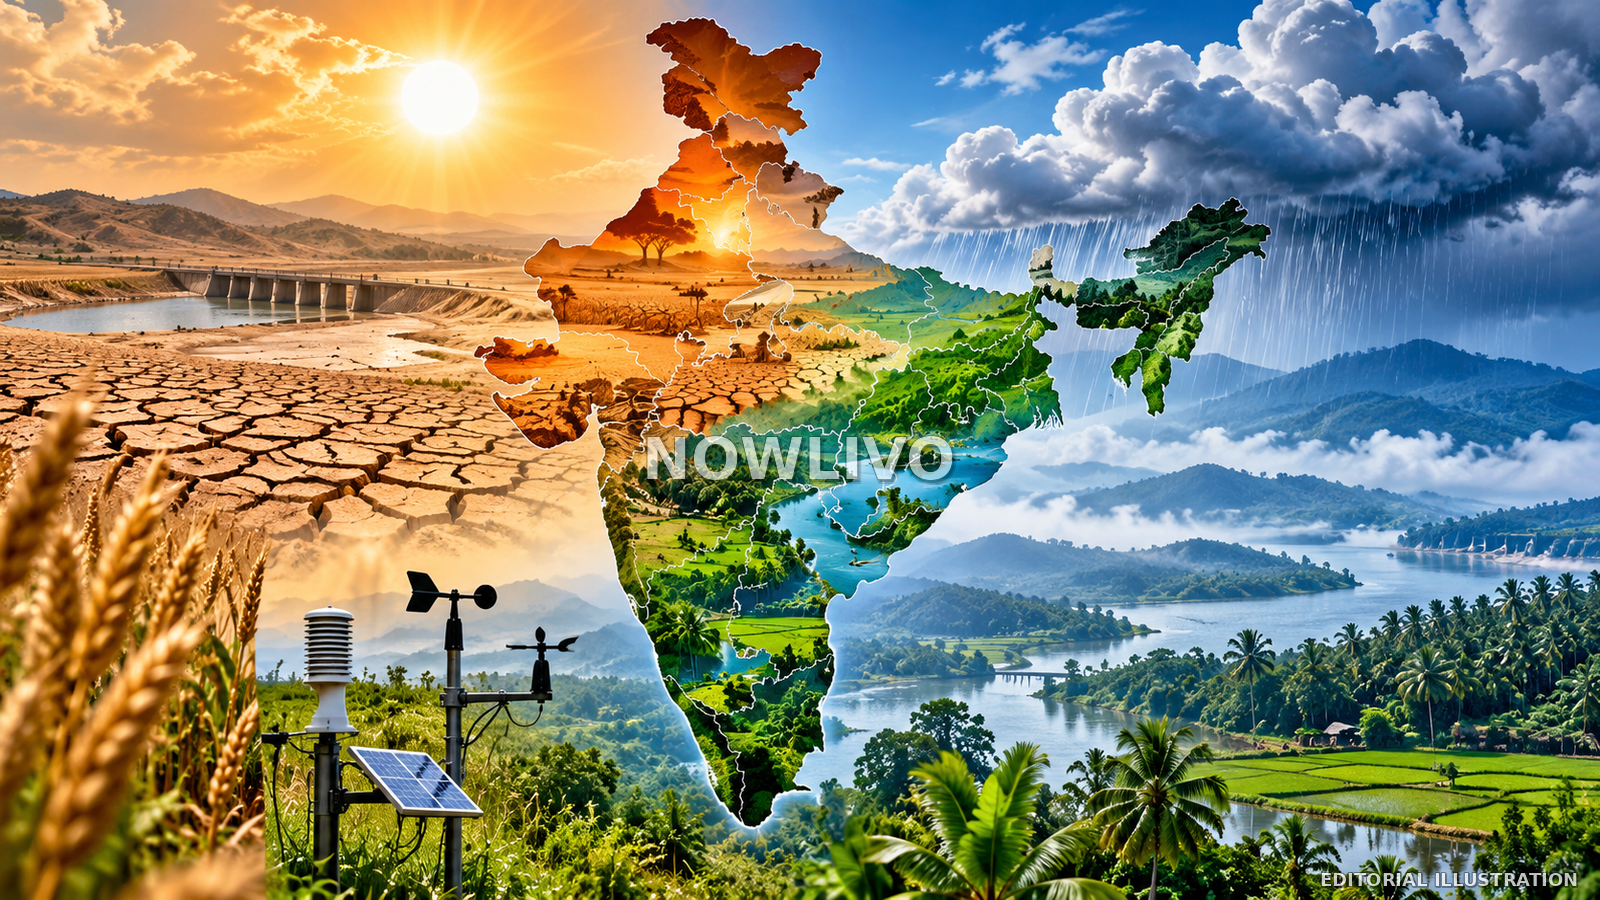
A study published in the India Meteorological Department’s journal Mausam finds that large parts of northern and north-western India have shifted toward hotter, drier climate zones over roughly seven decades, while much of peninsular India has become wetter. Researchers compared climate maps for the standard 30-year periods 1951–1980 and 1991–2020 using historical observations. The analysis suggests that the hot semi-arid zone once described as ending in western Uttar Pradesh has extended farther east. The findings do not forecast weather for a single season; they describe a long-term shift with consequences for agriculture, water management and disaster planning. Local outcomes will still depend on geography and rainfall variability.
How the study measured climate change
The research team redrew India’s climate map for successive 30-year periods, a common approach for separating long-term climate patterns from year-to-year weather variability. It examined temperature and rainfall to identify zones such as hot semi-arid, tropical savanna, tropical monsoon and temperate climates. The comparison offers a structured way to see whether a region’s baseline conditions have shifted, rather than relying on an unusually wet monsoon, a severe drought or one heat wave.
The two periods are not simply a comparison between one year in the 1950s and one year today. They summarise climate over several decades, reducing the influence of short-term fluctuations. That distinction matters because an individual season may be unusually wet or dry for reasons that do not represent the long-term average. The study instead asks whether underlying patterns in temperature and rainfall have changed enough to alter the broad climate classification of a region.
The dry zone has expanded in the northwest
According to reports on the study, the hot semi-arid zone grew from about a quarter of north-west India’s area during 1951–1980 to around one-third during 1991–2020. The temperate zone’s share shrank from roughly a quarter to less than a fifth. Researchers described the dry zone as pushing eastward into Uttar Pradesh, an important agricultural belt where shifts in heat and available moisture can affect farming decisions and demand for irrigation.
The change reflects a combination of rising temperatures and shifts in rainfall patterns. A hotter, drier baseline can increase stress on crops and soils when a monsoon underperforms. It can also change how quickly soil moisture is lost and how farmers decide when to sow or harvest. The study does not mean every northern district is becoming uniformly dry, but it identifies a regional direction that water managers and agricultural planners should consider alongside local data.
Peninsular India shows a different pattern
The study found that much of peninsular India moved toward wetter climate classifications over the same period. Reports on the analysis say the hot semi-arid zone in the peninsula shrank from about 30% of the region’s area to 16%, while tropical savanna areas expanded. The tropical monsoon zone also extended across parts of the Konkan, Goa, coastal Karnataka and Kerala. These mapped changes suggest that the trend is not identical across the country.
A wetter long-term classification does not automatically mean every season will deliver more useful rain. Precipitation may arrive in intense downpours, be unevenly distributed or produce flooding rather than dependable water for farms. Local terrain, drainage, soil and reservoir capacity determine whether a change improves water security or creates new hazards. The policy implication is to plan for regional differences rather than relying on a single national rainfall figure.
Why the findings matter for agriculture
Climate conditions influence what farmers grow, when they plant, how much irrigation they need and how vulnerable crops are to late or failed rains. If a region’s climate baseline becomes hotter and drier, crop calendars and water assumptions based on older conditions may become less reliable. Researchers have highlighted the need to pay attention to sowing and harvesting in northern India’s key agricultural areas, where changes in moisture availability can affect both yields and farm costs.
Adaptation options include drought-tolerant varieties, improved soil-moisture conservation, changes to irrigation scheduling, crop diversification and locally tailored advisories. These choices should not be made from a broad national map alone. District-level climate information, farmer experience, soil conditions and seasonal forecasts are needed to turn a climate-zone shift into practical guidance. A map can indicate where attention is required; local data help determine which intervention makes sense for a particular crop and community.
Water management cannot be one-size-fits-all
The contrast between drier northern areas and wetter parts of the peninsula highlights the limits of national averages. A country-wide rainfall figure can hide sharp regional differences. Some areas may face more pressure on groundwater and irrigation, while others may need stronger drainage capacity or better preparedness for intense rainfall and floods. The same region can also experience a dry season followed by heavy rainfall, so managing variability is as important as understanding averages.
Planning must account for how water is stored and moved. Groundwater, reservoirs, tanks, rivers and rainwater-harvesting systems respond differently to rainfall and temperature changes. Long-term climate evidence can help governments prioritise infrastructure, but decisions should be based on detailed local assessments rather than assuming that a wetter region has no water problem. Water quality, distribution networks, population growth and competing demand can all affect whether rainfall translates into reliable supply.
Limits of a climate-zone map
A climate classification is a useful diagnostic tool, but it does not capture every local factor affecting livelihoods. Land use, urban growth, irrigation, groundwater extraction, crop choices and infrastructure can alter how a climate signal is experienced. Nor does a long-term trend specify the exact rainfall or temperature a locality will experience next week or next season. Seasonal forecasts and day-to-day weather warnings remain necessary for immediate decisions.
The reported findings also do not include every region-by-region measurement in the summaries available so far. The peer-reviewed paper is the place to examine methods, uncertainty and precise values behind each mapped change. Readers should avoid turning a broad trend into an unsupported claim that every northern district will face drought or every southern district will see flooding. Scientific caution is not a reason to dismiss the trend; it is how the finding is translated responsibly into local policy.
What happens next
The next step is to connect long-term climate maps to practical regional planning. Scientists can refine the spatial picture, compare it with other datasets and explain the uncertainty around each shift. State governments can use the findings to review agricultural guidance, water allocation and disaster preparedness. The study does not replace monsoon forecasts, but it can change the background against which those forecasts are interpreted.
If climate normals are moving, infrastructure and crop plans designed around historic averages may need updating. The most valuable outcome would be a clearer link between research and decisions at district level: which crops need altered calendars, which water systems need more storage or drainage, and which communities face a changing risk profile. The finding is a call for better planning, not a prediction that every part of India will experience the same climate future.